
Government of Canada; Environment and Climate Change Canada; WSTD-WHERD
Type of resources
Topics
Keywords
Contact for the resource
Provided by
Years
Formats
Representation types
Update frequencies
status
-

This dataset contains lake-wide algal bloom indices (extent, intensity, and severity) of Lake Erie on a daily basis over the June through October monitoring season. These data are derived from satellite remote sensing algorithms using European Space Agency's (ESA's) MEdium Resolution Imaging Spectrometer (MERIS) sensor on the Envisat satellite (2002-2012) and ESA's Ocean and Land Colour Instrument (OLCI) sensor on the Sentinel 3A and Sentinel 3B satellites (2016-present). Citation: Binding, C.E., Pizzolato, L., & Zeng, C. (2021). EOLakeWatch; delivering a comprehensive suite of remote sensing algal bloom indices for enhanced monitoring of Canadian eutrophic lakes. Ecological Indicators, 121, 106999. doi:10.1016/j.ecolind.2020.106999
-
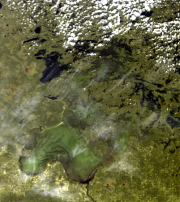
This dataset contains lake-wide algal bloom indices (extent, intensity, and severity) of Lake of the Woods on a daily basis over the June through October monitoring season. These data are derived from satellite remote sensing algorithms using European Space Agency's (ESA's) MEdium Resolution Imaging Spectrometer (MERIS) sensor on the Envisat satellite (2002-2012) and ESA's Ocean and Land Colour Instrument (OLCI) sensor on the Sentinel 3A and Sentinel 3B satellites (2016-present). Citation: Binding, C.E., Pizzolato, L., & Zeng, C. (2021). EOLakeWatch; delivering a comprehensive suite of remote sensing algal bloom indices for enhanced monitoring of Canadian eutrophic lakes. Ecological Indicators, 121, 106999. doi:10.1016/j.ecolind.2020.106999
-
Blooms of filamentous benthic algae that plagued Lake Erie in the 1950s through 1970s were largely reduced through reductions of phosphorus (P) loading from point sources. Since the mid-1990s, these blooms have returned despite a period of relatively stable external P inputs. While increased loadings of dissolved P have been causally linked to cyanobacterial blooms in some parts of the lake, the impacts of ecosystem changes such as the effect of invasive species on nutrient cycling and availability have not been fully elucidated, leading to uncertainty as to the effectiveness of additional non-point P management actions. Here we use the oxygen isotope ratios (δ18OP) of phosphate in concert with measures of water quality along the northern shore of the east basin of Lake Erie to identify sources and pathways of P cycling and infer potential importance in relation to annual blooms of Cladophora that foul the shorelines of eastern Lake Erie. δ18OP data indicate that potential external source signatures are rapidly overprinted by biological cycling of P by the plankton community and that much of the available phosphate in the nearshore waters is derived from hydrolysis of dissolved organic P compounds. Near the dreissenid-colonized lake bed, δ18OP was persistently and significantly enriched in 18O relative to δ18OP measured in surface waters and was similar to δ18OP of phosphate excreted by dreissenid mussels in incubations. These results implicate dreissenid mussels as key agents in nearshore P cycling and highlight the importance of considering ecosystem changes in the development of nutrient management strategies designed to ameliorate symptoms of eutrophication. For more information and data please visit:https://open.canada.ca/data/en/dataset/4497ebe5-f45e-4b13-9e98-e9edd016fc66
-
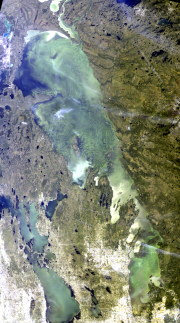
This dataset contains lake-wide algal bloom indices (extent, intensity, and severity) of Lake Winnipeg on a daily basis over the June through October monitoring season. These data are derived from satellite remote sensing algorithms using European Space Agency's (ESA's) MEdium Resolution Imaging Spectrometer (MERIS) sensor on the Envisat satellite (2002-2012) and ESA's Ocean and Land Colour Instrument (OLCI) sensor on the Sentinel 3A and Sentinel 3B satellites (2016-present). Citation: Binding, C.E., Pizzolato, L., & Zeng, C. (2021). EOLakeWatch; delivering a comprehensive suite of remote sensing algal bloom indices for enhanced monitoring of Canadian eutrophic lakes. Ecological Indicators, 121, 106999. doi:10.1016/j.ecolind.2020.106999
-
This dataset was extracted from the 50-member Large-Ensemble Canadian Regional Climate Model (CanRCM4-LE) (Scinocca et al., 2015), North American region 0.44° horizontal grid resolution (NAM-44) model runs. Basin averaged means for nine river basins in Western Canada consisting of three variables: mean daily temperature (tas: K); precipitation (pr: kg m-2 s-1); and surface snow amount (snw: kg m-2) are provided.
-
Lake Simcoe is located North of Toronto in Ontario, Canada and is a premier destination for tourists generating $200 million in revenue annually. Lake Simcoe is the 4th largest lake in Ontario with a surface area of 722 square kilometers and a watershed of 2900 square kilometers. Lake Simcoe has been negatively impacted by anthropogenic activity since the 1930's. In 2007, the Lake Simcoe Cleanup Fund was created to address increased phosphorus inputs, reproductive failure of the cold water fishery, nuisance aquatic plant growth and invasive species.Here we present nutrient and sediment data that was collected to inform decisions pertaining to the restoration of Lake Simcoe.
-
River ice is a known occurrence in cold climate hydrological systems. The annual cycle of formation, growth, decay and clearance of river ice can include low flows and ice jams, as well as mid-winter and spring break-up events. Reports and associated data on river ice occurrence are often limited to site and season specific studies. Within Canada, the National Hydrometric Program (NHP) operates a network of gauging stations with water level as the primary measured variable. It is well known by the hydrologic community that river ice related information can be extracted from water level records. Near two decades ago, the Water Science and Technology Directorate of Environment and Climate Change Canada initiated a long-term effort to compile, archive and extract river ice related information from hydrometric records. As a result, this work has delivered an original research data set: the Canadian River Ice Database (CRID). The CRID includes near 71,000 river ice variables from a network of 196 NHP sites throughout Canada in operation within the period 1894 to 2015. The task of compiling this database involved manual extraction, data entry and input of more than 460,000 information fields on water level, discharge, date, time and data quality rating. In excess of 100,000 paper and digital files were reviewed with the network representing over 10,000 station years of active operation. This database follows up on several earlier efforts to compile information on river ice and expands the scope and detail for use in Canadian river ice research and applications. At each location, time series of up to 15 river ice variables specific to occurrence of freeze-up and winter-low events, occurrence of mid-winter break-up, ice thickness, spring break-up and maximum open-water level is compiled. Following the Government of Canada Open Data initiative, this original river ice data set is available to the public.
-
Off shore waters of Georgian Bay rarely experience excessive nutrient concentrations however, small embayments such as Honey Harbour, North and South Bay have experienced oxygen depletion, increased total phosphorus, a decrease in water clarity and the presence of filamentous attached algae. Low water levels in southern Georgian Bay along with temperature and hydrologic changes represent additional water quality and aquatic habitat management challenges.To address these issues the Government of Canada initiated the Lake Simcoe / South-eastern Georgian Bay Clean-Up Fund. The Fund supports various projects to improve conditions and supports science efforts to advance understanding of these conditions. Here we present water quality and physical data to investigate the causes and consequences of oxygen depletion and characterize phosphorus. Samples were collected monthly 2013 to 2016 during the ice free season from 9 stations in North and South Bay, 10 tributaries and 9 stations in Tadenac Bay, an unimpacted embayment. Winter sampling occurred in 2015 and 2016 at select stations.
-
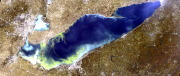
This dataset contains annual algal bloom indices (duration, extent, intensity, severity) summary statistics (maximum, mean) over the June through October monitoring period for Lake Erie. These data are derived from satellite remote sensing algorithms using European Space Agency's (ESA's) MEdium Resolution Imaging Spectrometer (MERIS) sensor on the Envisat satellite (2002-2012) and ESA's Ocean and Land Colour Instrument (OLCI) sensor on the Sentinel 3A and Sentinel 3B satellites (2016-present). At the end of each monitoring season, data are presented in annual report format including current and historical summary statistics of algal bloom indices, alongside relevant imagery. Citation: Binding, C.E., Pizzolato, L., & Zeng, C. (2021). EOLakeWatch; delivering a comprehensive suite of remote sensing algal bloom indices for enhanced monitoring of Canadian eutrophic lakes. Ecological Indicators, 121, 106999. doi:10.1016/j.ecolind.2020.106999
-
The Great Lakes Basin Integrated Nutrient Dataset compiles and standardizes phosphorus, nitrogen, and suspended solids data collected between the 2000-2019 water years from multiple Canadian and American sources around the Great Lakes. Ultimately, the goal is to enable regional nutrient data analysis within the Great Lakes Basin. This data is not directly used in the Water Quality Monitoring and Surveillance Division tributary load calculations. Data processing steps include standardizing data column and nutrient names, date-time conversion to Universal Time Coordinates, normalizing concentration units to milligram per liter, and reporting all phosphorus and nitrogen compounds 'as phosphorus' or 'as nitrogen'. Data sources include the Environment and Climate Change Canada National Long-term Water Quality Monitoring Data (WQMS), the Provincial (Stream) Water Quality Monitoring Network (PWQMN) of the Ontario Ministry of the Environment, the Grand River Conservation Authority (GRCA) water quality data, and Heidelberg University’s National Center for Water Quality Research (NCWQR) Tributary Loading Program.